FlushCache messages might not be an actual IO stall
At a client site recently a SQL Server 2012 (Enterprise, SP1 + CU#9) server with 512GB RAM and 80 cores (40 cores assigned to SQL Server) that had been patched and restarted displayed the following symptoms after an index reorg operation was restarted: CPU saturation, with all cores available to SQL Server (but not all cores on the box) almost totally maxed out and the perfmon data showing an average of 96% CPU usage for those CPUs.
The server was all but inaccessible with users reporting trouble connecting for between 5-10 minutes, after which point CPU usage settled back down and normal performance was resumed.
Cancelling the index reorg appeared to have no affect on the duration of the issue.
Shortly after CPU usage returned to normal I found the following messages in the error log:
FlushCache: cleaned up 70316 bufs with 51811 writes in 197020 ms (avoided 17940 new dirty bufs) for db 5:0 average throughput: 2.79 MB/sec, I/O saturation: 481, context switches 1041 last target outstanding: 38800, avgWriteLatency 0 FlushCache: cleaned up 36001 bufs with 26512 writes in 94525 ms (avoided 23060 new dirty bufs) for db 5:0 average throughput: 2.98 MB/sec, I/O saturation: 983, context switches 1107 last target outstanding: 38800, avgWriteLatency 0
These messages are logged (automatically in SQL Server 2012, otherwise via trace flag 2504, see Further Reading link at end of post) when SQL Server is running a checkpoint but the checkpointing process took longer than the configured recovery interval, which by default is one minute.
The first FlushCache message shows 70316 buffer pages: 70316 x 8K = 549.34MB, divide that by the 197020 ms duration reported gives you that 2.79 MB/sec throughput rate.
The server was in an Availability Group so I failed over and tried again; same problem. I failed back and tried a third time and the problem recurred a third time. This (as of the time of writing) is the latest publicly available SQL Server 2012 build and I was getting a bit worried, so I posted the question on the #sqlhelp alias and got the kind of responses I would probably have posted; on the face of it, this indicates an IO bottleneck but I wasn’t buying it as the server has flash storage which the database was located on and had a huge buffer pool (max server memory set to 448 GB) available to it.
I looked at the perfmon data I had from that period and I drew out the ‘Disk Transfers/sec’ counters alongside the ‘% Process Time’ for sqlservr.exe and sure enough it showed an apparent disk stall coinciding with the CPU spike, with the average disk transfers dropping from @3,400 to < 100 during this period. This appeared to ‘prove’ an IO stall. However, on this server we have disks running on SAN and local flash storage running off the PCI bus and all disks showed this apparent stall, and this is what made me a little suspicious.
Sure, with all CPUs maxed throughput everywhere is going to crash, but if this was a genuine IO stall I would expect disks on the specific subsystem this database was using to suffer, not a blanket stall across all disks (and not all available CPUs to be maxed out, for that matter).
As the checkpoint process is flushing dirty pages from memory I homed in on SQL Server’s memory counters, namely ‘Target Server Memory (KB)’ and ‘Total Server Memory (KB)’ and then things started to fall in place.
Shortly after the index reorg operations were triggered, we see a sharp rise in the ‘Total Server Memory (KB)’ counter, so SQL Server appears to be allocating more memory.
However, at the same time CPU usage maxes out as the CPUs get saturated and they stay saturated until they hit ‘Target Server Memory (KB)’ at which point CPU usage descends very sharply back to normal and we see a sharp drop off in ‘Total Server Memory (KB)’ (to a point where it’s significantly lower than when the problem started), which in itself does not make sense as the buffer pool has not reached its max server memory limit but confirms the flushing behaviour.
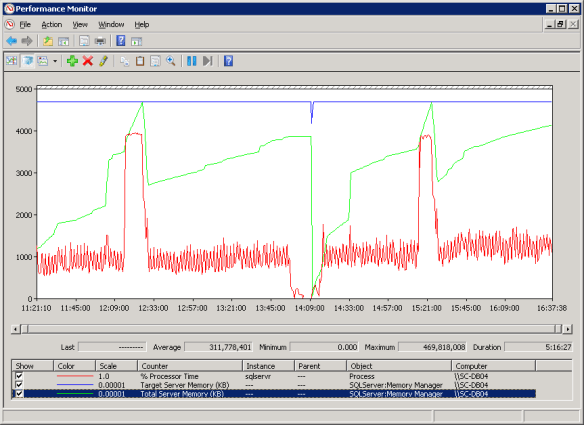
Figure 1: Perfmon output showing index re-org triggering flushcache messages
Figure 1 shows the perfmon data which captured two occurrences of the problem. The blue line is the ‘Target Server Memory (KB)’ counter which is at the buffer pool limit of 448 GB, red is the SQL Server ‘% Processor Time’ counter and green is the ‘Target Server Memory (KB)’ counter.
They show the issues which started @ 12:15 and 15:15. The CPU drop off in the middle is from an Availability Group failover/failback during which CU#9 for SQL Server 2012 SP1 was applied as it fixed an issue related to reindexing.
Call me Sherlock, but on the face of it, it looks as if the index reorg triggers a race condition within the db engine where it is both allocating memory into the buffer pool and trying to free memory from the pool and these two operations don’t play nice with each other.
The operation increasing the buffer pool size wins, eventually, after getting to its maximum configured size and maxing out the CPUs on the way, after which point the operation clearing dirty pages completes and dumps out those FlushCache messages which implicate the IO subsystem (falsely IMHO), and we see a corresponding freeing of pages in the perfmon graph and the resumption of normal CPU usage.
An index reorg operation should be something that we can run whenever and should not trigger this behaviour.
Setting max server memory equal to min server memory may be a workaround here as so many people on twitter mentioned, but I don’t want to prolong how long SQL Server takes to initialise so won’t be doing that, although I have bumped up the min server memory value.
If you’ve seen this message in your server maybe this will help you get to the bottom of your issue (assuming you have definitely ruled out IO issues).
Further reading:
Bob Dorr’s explanation about these FlushCache messages.
Related posts
Tracking SQL Server IO performance with Performance Monitor (Perfmon)
Misaligned disk partition offsets and SQL Server Performance
SQL Server wait stats
Impact of Fusion-io based tempdb on reindex duration
Tracking SQL Server IO Performance
Tempdb configuration and performance