The SQL Server default trace
The SQL Server default trace is useful!
The SQL Server default trace (introduced from SQL Server 2005 onwards) is a background sql server trace that runs continuously and records event information that, despite the adverse comments on the web about its value, can be useful in troubleshooting problems. Not only that, but it’s there out-of-the box so you don’t have to do put any effort into enabling or managing it.
This blog post intends to show that, in the right hands, the default SQL Server trace in SQL Server 2005 and SQL Server 2008 can yield very useful information.
What is the default trace
A default installation of SQL Server 2005/2008 results in a lightweight server-side trace running continuously in the background.
The trace records a handful of events to a trace file which can be loaded up and reviewed in SQL Profiler, just the same as any other trace file.
By default, five trace files are kept in the same folder as the SQL Server error log. Each file has a size limit of 20MB before it rolls over to the next file. After the fifth file is filled, the default trace rolls over to the first file, and so on.
To confirm if the trace is enabled, run the following query:
-- check if the default trace is enabled sp_configure ‘default trace enabled’
A run_value of 1 indicates the default trace is enabled and should be active.
If the trace is enabled, the following query will list the details:
-- check if the default trace is active and running select * from sys.traces where is_default = 1
Amongst the output will be confirmation that the trace is running (is_shutdown will be set to 0 if it is running, otherwise it will be 1). The path column will show the full path and name of the current default trace output file.
Interrogating the default trace
Getting information out of the default trace file is much the same as getting information out of any other SQL Profiler trace file. There are multiple options, from simply loading the file in SQL Profiler, interrogating it directly via T-SQL statements, or by loading it into a table.
I’ve used all three methods in the past. The method you use depends on your own preferences and immediate requirements.
The examples in this blog will interrogate the trace files directly, as that’s the quickest way to get up and running and view the contents of the trace.
With more experience, the trace file can be regularly polled via e.g. a stored procedure that can be incorporated into standard health-checks to automatically retrieve events of any interest; you decide what those interesting events are. More on that later.
The queries I will demonstrate in this post reference a system table called sys.trace_events. This is used to get the graphical name of the events I’m interested in (otherwise we will only see the numeric event id, as that is what the default trace records).
This table, introduced in SQL Server 2005 holds details of the all the eventclass ids a SQL trace uses, so you can use this to identify which eventclass id corresponds to which event, which is how I established eventclass 20 is a login failed event (the actual event is Audit login failed).
First things first
The first thing to do is isolate the trace file in question.
Assuming the default trace is enabled and running the following query will return the current trace file and its location:
-- find out where the defaul trace files are being written to select [path] from sys.traces where is_default = 1
If the current trace does not overlap with the time of the error you are trying to track down, go to the location of that trace file and identify which of the preceding trace files is from the correct time period. As a precautionary next step, make a copy of the trace file, so you have a permanent record, and also to prevent the file being overwritten during a subsequent rollover.
This post has sprawled out into something that i should have really split up into smaller, more succinct posts, but hindsight is a wonderful thing so as a compromise the table below contains a link to each of the examples:
Example 1: Finding out who filled up tempdb (or any other database for that matter…)
So, let’s get started. A common scenario for a dba is getting called out overnight because somebody, or some thing has maxed out all the space in e.g. tempdb.
Using the fn_trace_gettable function to interrogate the trace file directly we can get some useful information about the cause. Assume there was an 1105 error just before 21:00 last night (“Could not allocate space for object ” in database ‘tempdb’”).
To find this out it’s just a question of confirming when the exact time the database full error occurred and filtering the trace from that period for events in that database. The query below does just that (edit appropriately for the trace file details and time period in question).
select te.name as [event],e.textdata, e.applicationname, convert (varchar(20), object_name(e.objectid)) as object, e.spid, e.duration/1000 as [duration (ms)], e.starttime, e.endtime, e.databasename, e.filename, e.loginname, e.hostname, e.clientprocessid from fn_trace_gettable(‘C:\Program Files\Microsoft SQL Server\MSSQL.1MSSQL\LOG\log_326.trc’, default) e inner join sys.trace_events te on e.eventclass=te.trace_event_id where databasename = ’tempdb’ and e.starttime between ‘2009-09-24 20:30’ and ‘2009-09-24 21:00’ order by e.starttime
1: Who maxed out tempdb (or any other database)?

Output of which session filled tempdb
The query tracks all events in tempdb that occurred in tempdb for about half an hour before the tempdb full error.
Most of the events causing this type of issue will be object creation and autogrow as can be seen above. What we will also have is what was causing them; applicationname , loginname, spid, hostname and clientprocessid . These should all be enough to identify who or what was responsible for the tempdb issue (see fig. 1).
Sometimes, the objectname column will have the names of the tables being created, and the spid column will allow you to narrow down the trace even further in case tracing events half an hour before the database full problem occurred presents too much or too little data.
Needless to say, but I’ll say it anyway, change the databasename column to the name of the database you’re interested if you’re looking for events leading to the same issue in another database.
Also, the trace can be filtered on object creation (trace_event_id = 46) or data or log file autogrow (trace_event_id = 92 or 93) events. For example, the following variation of the above query will pick out all the autogrow events, when they occurred, how long they took and how much space each autogrow increased the size of the data file by. Edit the trace file name and path as necessary.
select te.name as [event],e.applicationname, e.spid, e.duration/1000 as [duration (ms)], e.starttime, e.endtime, e.databasename, e.filename, (e.IntegerData *8)/1024 as [growth (mb)], e.loginname, e.hostname, e.clientprocessid from fn_trace_gettable(‘C:\Program Files\Microsoft SQL Server\MSSQL.1MSSQL\LOG\log_326.trc’, default) e inner join sys.trace_events te on e.eventclass=te.trace_event_id where e.EventClass in (92,93) order by e.starttime
Additionally, it will also show the SPID that caused the autogrow, so you can then go back and filter on just that spid (and the time period of the autogrows) to get a fuller picture of what caused the space usage.
Without this information you have nothing to go on, unless you happened to be logged in at the server at the time the issue was occurring and realised that there was a long running transaction running against tempdb which was going to cause it to fill up.
You might also notice that for the autogrow events the Duration column records how long the autogrow took – very useful in identifying potential IO performance isues (or impractical file growth settings).
The object column returns the name of the object being referenced/created. If this query is not run against the trace file on the server that the error occurred on, the chances are this column will contain NULLs, so you can select just the raw objectid instead to view the values and then manually retrieve the object names from the affected server.
Incidentally, the fn_trace_gettable function is also the function used to load a trace file into a database table.
Example 2: Isolating login failures
OK, so the default trace has some use, but what else can it do?
Suppose you get the occasional login failure on a system, you’re not too worried as that’s inevitable sometimes, but from time to time the login failure is for sa and the ip address logged in the error log doesn’t correspond to any workstation belonging to a dba who should have access. You should be worried now. As per the previous queries, edit the trace file name as required.
select e.name as eventclass, t.textdata, t.hostname, t.ntusername, t.ntdomainname, t.clientprocessid, t.applicationname, t.loginname, t.spid, t.starttime, t.error from fn_trace_gettable(‘c:\program files\microsoft sql server\mssql.1mssql\log\log_329.trc’, default) t inner join sys.trace_events e on t.eventclass = e.trace_event_id where eventclass=20

Output of login failure query
The query references the trace file from the period of the login failure and retrieves the columns containing all the information that should be needed to pin down where any login failure recorded in that file came from. I’ve already covered how to use this information in another blog posting covering how to identify the source of login failures.
Example 3: Identifying performance issues
So we’ve seen some practical applications like pinning down login failures and database or log growth issues which makes the default trace pay for itself in some ways. But wait, there’s more.
The bane of most dbas lives’ are application teams who will describe a performance problem they have: great, you say, what’s the application and SQL Server database, I’ll log on and take a look? Oh, it happened last week, some time in the afternoon the application team will reply. That’s OK, you (want to) say, I’ll just step into my time machine and go back a few days, or get in touch with my sixth-sense and carry out some sort of mind-meld with SQL Server and try and find out why it was mis-behaving a few days ago. [Disclaimer] Before you go any further I would like to make clear that none of this will be possible via the default trace. It can do quite a few things, but time-travel and mind-melds are slightly out of scope.
The default trace does offer some hope here. Because by default 5 trace files are kept (including the current trace files) there is a chance that the older trace files may cover the time period in question.
The default trace will capture some common performance affecting events, namely:
- Missing Column Statistics
- Hash Warning
- Sort Warnings
- Missing Join Predicate
So, if you still have the trace file from the period in question, a query like the following will pick out all the those events:
select v.name as [Event Class], TextData, SPID, Duration, StartTime, EndTime, DatabaseName, ObjectName, ClientProcessID, ApplicationName, LoginName, SessionLoginName, NTUserName from fn_trace_gettable(‘C:\log_180.trc’, DEFAULT) trc inner join sys.trace_events v on trc.EventClass = v.trace_event_id where v.name in (‘Missing Column Statistics’,‘Hash Warning’,‘Sort Warnings’,‘Missing Join Predicate’) and StartTime between ‘2009-09-05 14:00’ and ‘2009-09-06 16:00’
Example 4: Finding performance problem events
Let’s start by clarifiying that this is not going to tell us what the query was that generated these warnings. At the end of the day, the default trace is designed to be a low-impact trace that will not cause any performance or load issues so what it gathers is therefore restricted.
What we do have, however are details of when all these errors occcured, the PID of the offending client process, together with the hostname, application name and login name.
Armed with that information, we can then go back into that trace and zoom in on a particular spid or application. By narrowing down the spid or application, but expanding the events we’re looking at we can find out a bit more about the problem. I use a combination of the time period, spid and clientprocessid to narrow down (see my January 2009 blog on login failures on how to use this handy column to track down exactly what application is connecting). Modify the query with the relevant trace file path and time period details.
select v.name as [event class], textdata, spid, duration, starttime, endtime, databasename, objectname, clientprocessid, hostname, applicationname, loginname, sessionloginname, ntusername from fn_trace_gettable(‘c:\log_180.trc’, default) trc inner join sys.trace_events v on trc.eventclass = v.trace_event_id where starttime between ‘2009-09-05 14:00’ and ‘2009-09-06 16:00’ and spid = 57 and clientprocessid = 2044
Query 4: Narrowing down performance problems
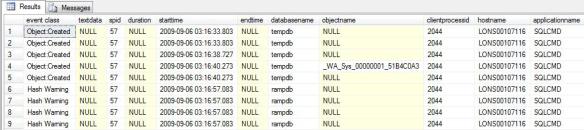
Output of highlighting performance problems query
I’ve replaced figure 3 with the output of an identical query (but using different time range parameters) trace from a server where the output allowed us to identify what query in a large batch job that was running overnight needed tuning. The output showed what time the query ran, the relevant details of the client application and the names of some of the tables/indexes that were affected .
Example 5: Finding out who dropped or altered that table
Perhaps one of the most useful aspects of the default trace is the fact that it records changes made to objects and server configuration changes
Suppose someone added or removed a column from a table? The following query highlights who did it. This time the query has been modified to grab the current trace file :
select t.starttime, e.name as eventclass, t.textdata, t.objectid, t.objectname, t.databasename, t.hostname, t.ntusername, t.ntdomainname, t.clientprocessid, t.applicationname, t.loginname, t.spid, t.error from fn_trace_gettable((select [path] from sys.traces where [is_default] = 1), default) t inner join sys.trace_events e on t.eventclass = e.trace_event_id where eventclass in (164,46,47)
Eventclass 164 is the Object:Altered event, 46 and 47 are the Object: Created and Delete events. Whilst the above query should show what application and login made the changes and when, it can return a lot of data on a busy system but it is easy enough to extend the where clause to e.g. filter on a specific database.
Example 6: Who changed the SQL Server configuration parameters
Also know as as the “it wasn’t me query”.
If the change concerned was e.g. a server configuration change like e.g. the max server memory setting, the following code will isolate the culprit
select e.name as eventclass, t.textdata, t.hostname, t.ntusername, t.ntdomainname, t.clientprocessid, t.applicationname, t.loginname, t.spid, t.starttime, t.error from fn_trace_gettable(‘C:\Program Files\Microsoft SQL Server\MSSQL.1MSSQL\LOG\log_339.trc’, default) t inner join sys.trace_events e on t.eventclass = e.trace_event_id where eventclass=22
Eventclass 22 is the ErrorLog event, so of course the changes can also be seen in the error log, but the error log won’t give you the details of who made the change.
Disabling the default trace
The chances are, most SQL Server 2005 (and beyond) systems are running this trace in the background without anyone even being aware of them, which in itself highlights what low impact these traces have. However, if CPU or disk resources are scarce the default trace can be disabled.
To disable the default trace, run the following commands (you sure you want to do this?) :
sp_configure ‘default trace’, 0 go reconfigure with override go
And finally…
This post was not intended to show ever possible piece of information that can be extracted from the default trace, but merely to highlight some of the things that can be found without too much effort.
Have a look at your own trace files as everyone installation and every application running against SQL Server is different – it’s a great way of pro-actively finding potential issues.
So go and explore…